In this article
Help us make these docs great!
All rapyuta.io docs are open source. See something that's wrong or unclear? Submit a pull request.
Make a contributionDeployment Details
Phases
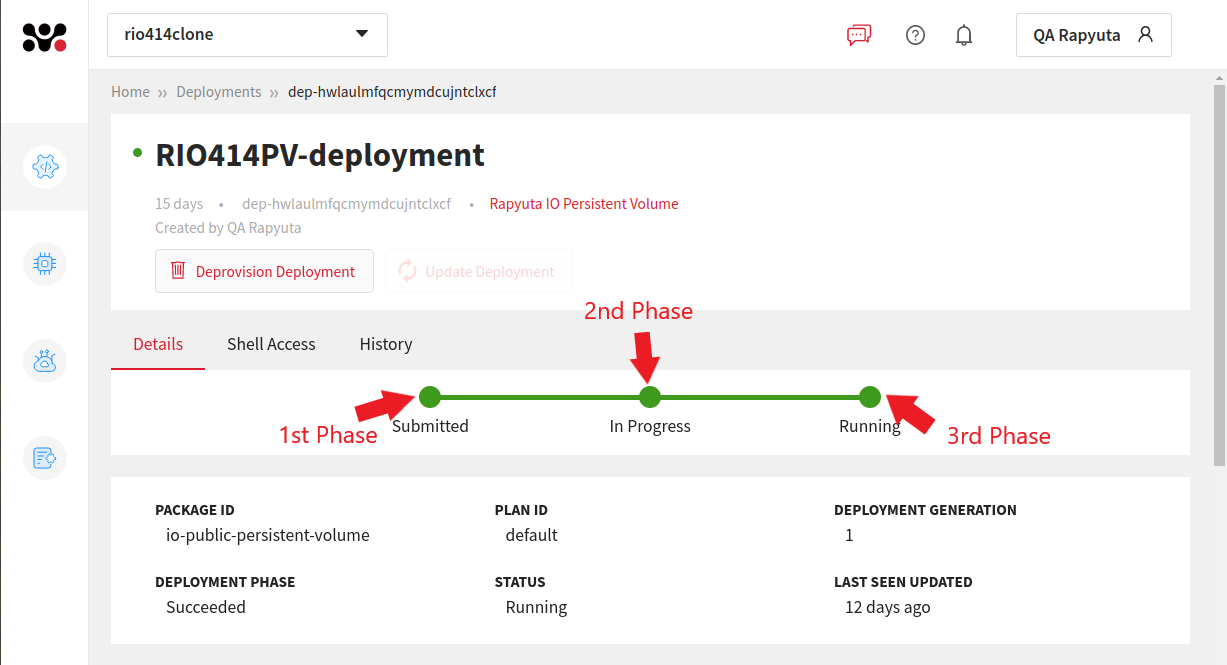
The lifecycle of a deployment consists of mainly 3 phases and the platform displays the status of the deployment at each phase.
-
First Phase: In the first phase of deployment, the status is displayed as Submitted that refers to the deployment request is submitted. After successful submission, the deployment moves to the second phase.
-
Second Phase: In the second phase, one of the following status is displayed.
- In Progress: This status is displayed when the deployment is getting provisioned and if there are no errors, it goes to the next phase else the status changes to one of the following errors.
- Provisioning error: This status is displayed if any error is encountered during the provisioning of the deployment.
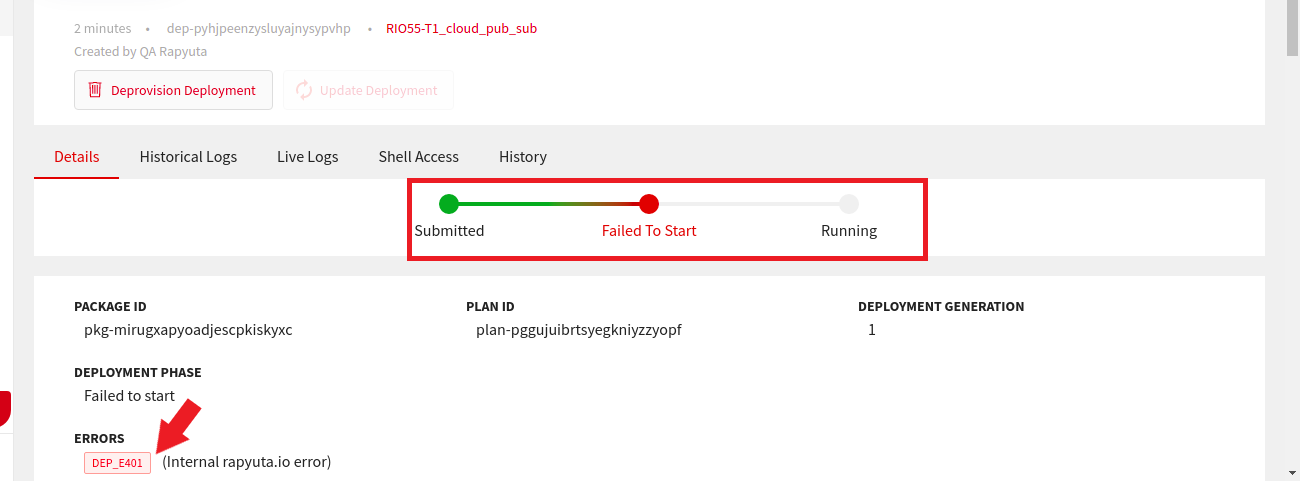
- Failed to Start: This status is displayed if the platform encounters an error while processing a deployment and fails to start the deployment.
- Unknown: This status is displayed if the platform is unaware of the current status.
The following image displays the status of the deployment when the deployment encounters an error in the second phase.
- Third Phase: If no errors are encountered in the second phase, the deployment process moves to the third phase and one of the following statuses is displayed.
- Running: This status is displayed if no errors are encountered and the deployment is successful.
- Failed to Update: This status is displayed if an error is encountered while updating the deployment.
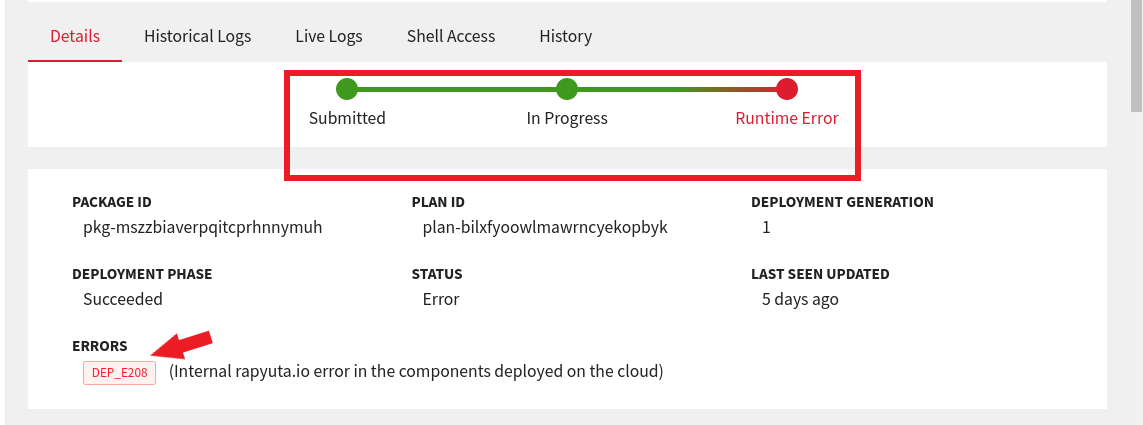
- Runtime error: This status is displayed if any component or platform encounters an error while running a deployment.
- Device offline: This status is displayed if the device goes offline.
- Partially de-provisioned: This status is displayed if you have deprovisioned a deployment, but there is at least one component that could not be deprovisioned.
The following image displays the status of the deployment when the deployment encounters an error in the third phase.
To know more or troubleshoot the errors encountered during the deployment phase, click here.
Status
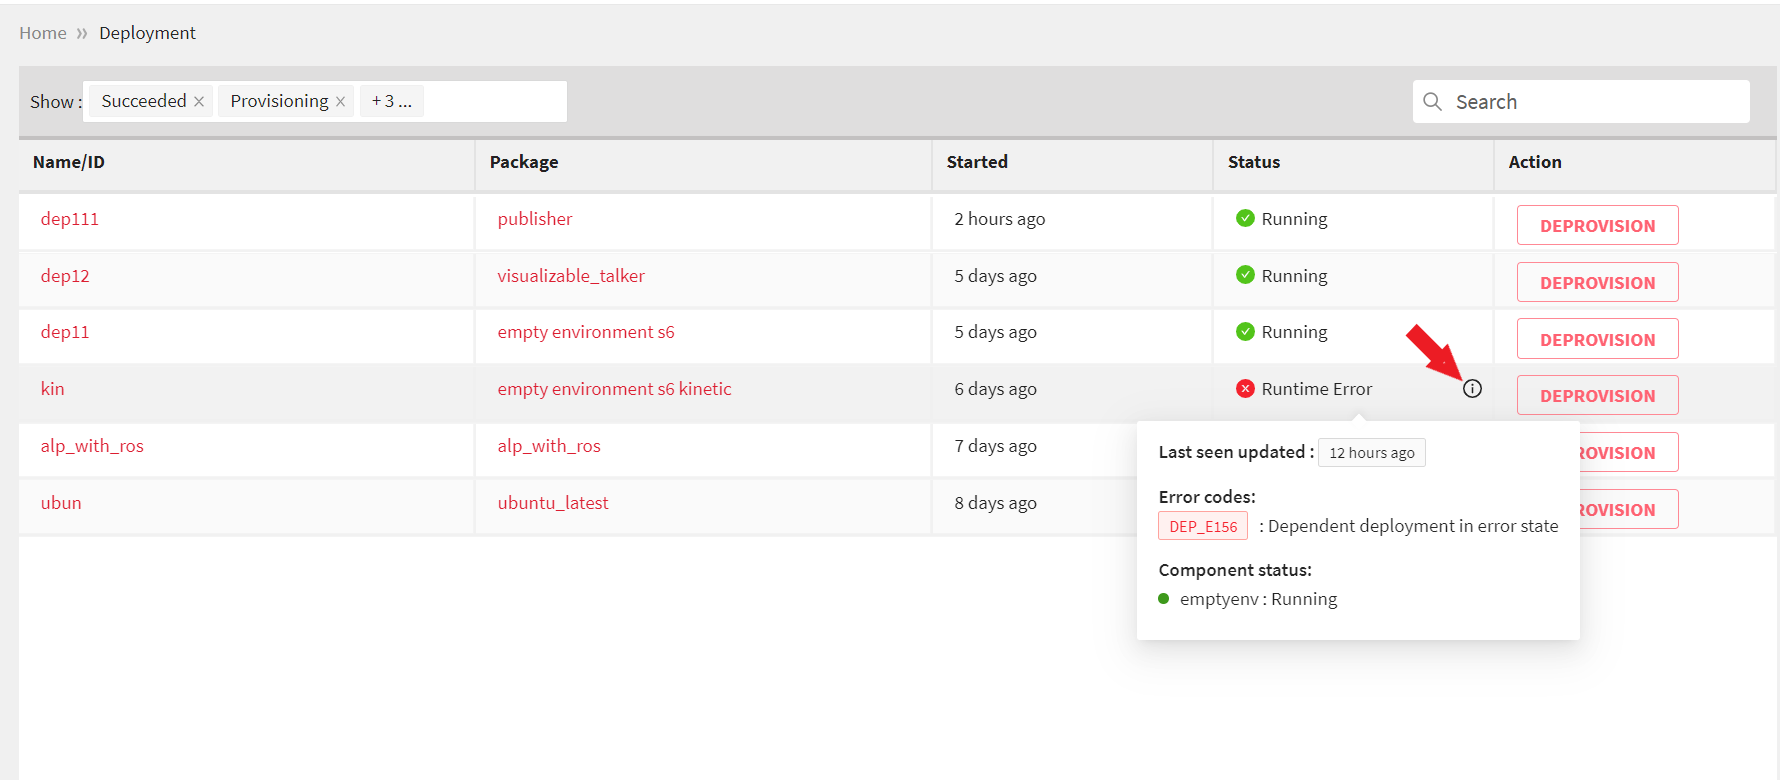
rapyuta.io allows you to view the current status of all the available deployments in a list form. If any deployment encounters any errors or failures, you can also view the details with the error codes just by hovering over the i icon next to the error statuses.
The following image displays the list view of deployments available on the platform.
Restart Policy
Unlike deployments running on the cloud, which automatically restart if stopped due to an error, deployments that are running on devices do not automatically restart if exited due to an error or when devices are rebooted.
You can configure the behavior of deployments running on devices by setting their restart policies. There are three kinds of restart policies available for a device deployment:
- Always
Always restart deployments if the deployment executables are in an error state or if the device is rebooted. - On-failure
Restart deployments only if the deployment executables exit due to an error, and the exit code is non-zero. - Never
Do not restart deployments under any circumstance.
There are a couple of exceptions while applying the restart policies:
- Restarting a deployment running on a device may fail if its executables are missing in $PATH. It is due to the components of the deployment failing to start.
- rapyuta.io components that are shared between deployments running on the same device (like ROS Master) will have the same restart policy as that of the first deployment on a device irrespective of the restart policies of any subsequent deployments on the device.
- If a deployment running on a device is stopped manually by stopping its docker container, both on-failure and always policies (if selected) are not applied unless the device is rebooted.
You can modify or override the initial setting of the restart policy while deploying a package. Read deploying a package topic to learn how to do so.
For a deployment running on a device, the variable Restart Count (on the deployment details page) represents the number of times the deployment has restarted due to restarting of deployment components.
Network Configuration for Executables
After you deploy a package that contains ROS components, you can view the cloud bridge and routed network statuses for each component used in the package. The rapyuta.io platform relies on a sub-component called the cloud bridge for implicitly establishing a communication channel between two or more ROS environments.
cloud bridge instances are automatically generated for the ROS components only.
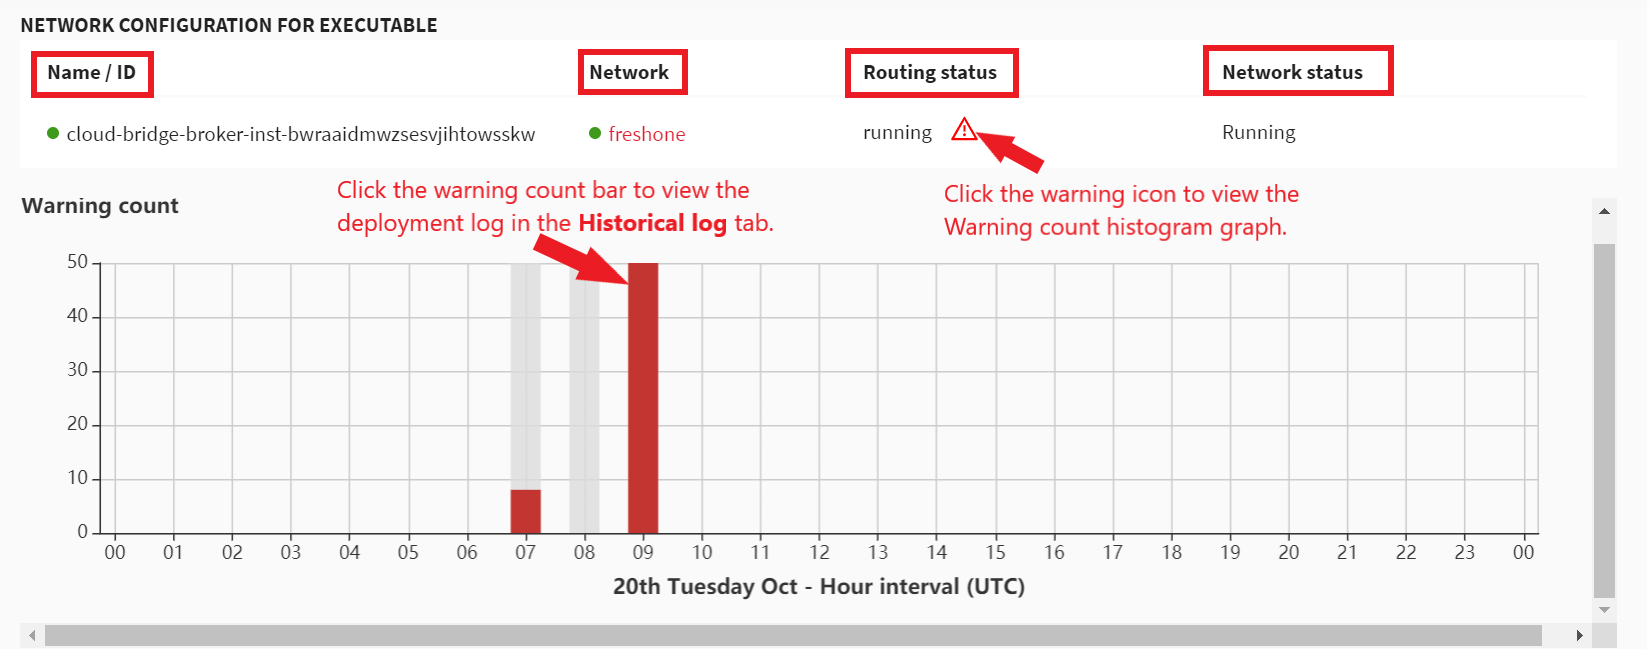
The following table displays the field description of the network configuration details section.
| Field | Description |
|---|---|
| Name/ID | Displays a unique name or ID of the cloud bridge component that is generated for a ROS component. |
| Network | Displays the associated routed network for the component. |
| Routing Status | Displays the following cloud bridge statuses of each component for a package.
|
| Network Status | Displays the following routed network statuses of each component for a package.
|