In this article
Help us make these docs great!
All rapyuta.io docs are open source. See something that's wrong or unclear? Submit a pull request.
Make a contributionDebugging using Logs
Deployment Logs
rapyuta.io provides historical logs for components, executables, and associated cloud bridges and native network clients for deployment in the cloud and on a device. Additionally, rapyuta.io offers to stream (live logs) and follow stdout/stderr for components deployed on the cloud.
Add a ROS package to rapyuta.io, which will have a component with cloud runtime. It will publish the ROS topic /telemetry with Maximum QoS and print debug information to stdout. Deploy the package on the cloud, and name the deployment as ROS publisher exclusive deployment.
To view the deployment logs:
-
In the rapyuta.io console, on the left navigation bar, click Development > Deployments.
-
Select a specific deployment whose logs you want to view or analyze.
In this example, select ROS publisher exclusive deployment.
-
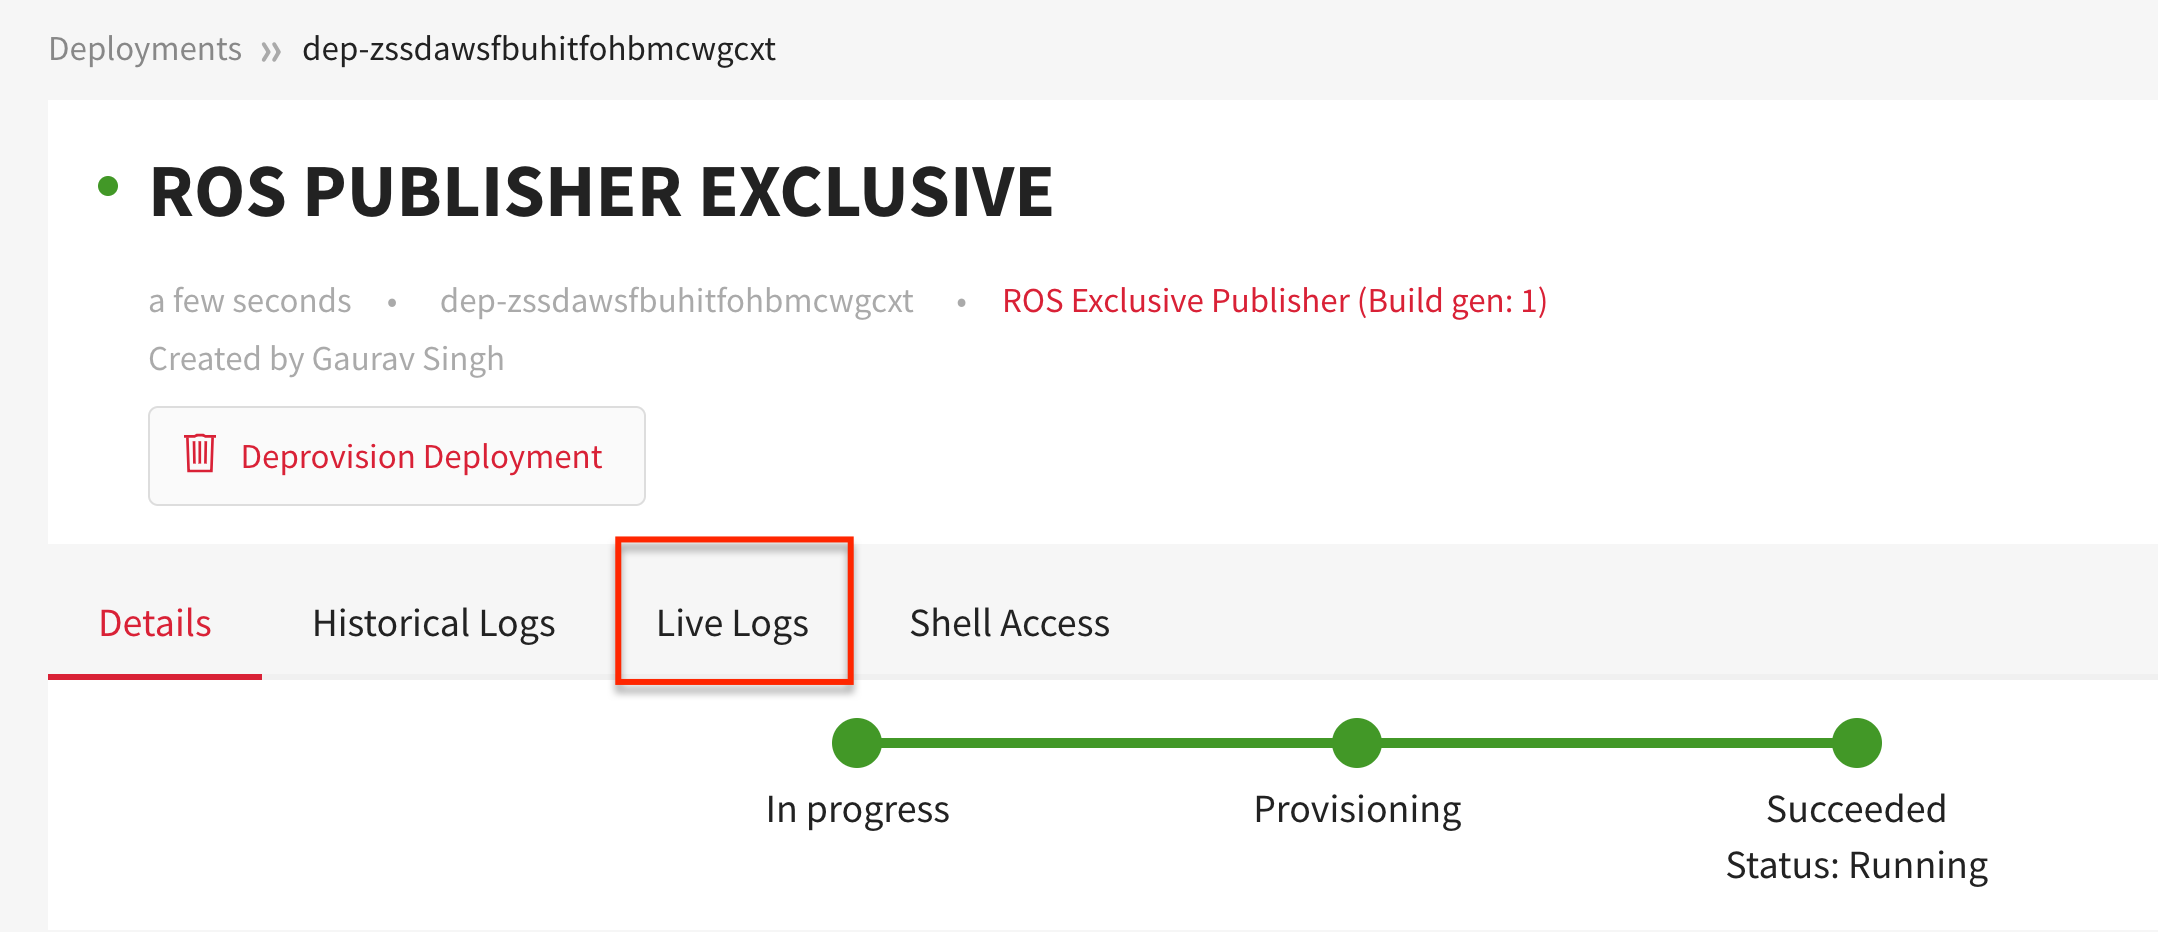
On the deployment’s DETAILS tab, ensure the green progress bar is at Succeeded and Status: Running.
Stdout Logs
To view or analyze the corresponding deployment logs, click Historical Logs.
The historical deployment logs is displayed, where you can:
-
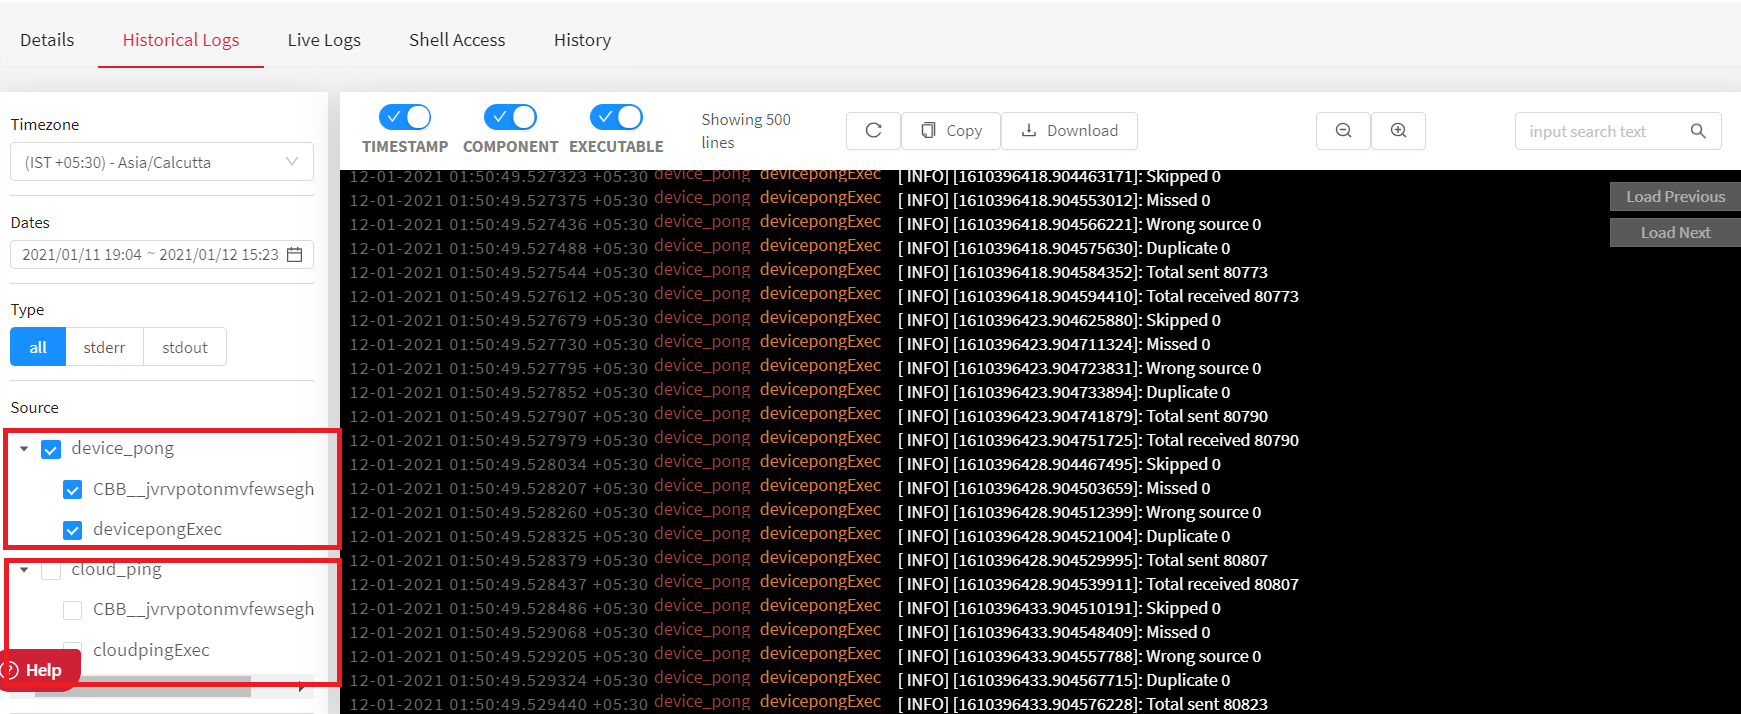
View the log’s timestamp, its component name, executable name, and the information or message.
-
Use the toggle button to filter the logs based on the timestamp, component, or executables available in the deployment.
-
Select a specific component-executable combination to view its corresponding logs. You may also select multiple such combinations. If you select only a component’s name, you will view all the logs generated by all of the executables of that component. If no component is selected, you will view all the logs generated by all of the components that are deployed. For example, the historical logs of only the Talker component are shown below.
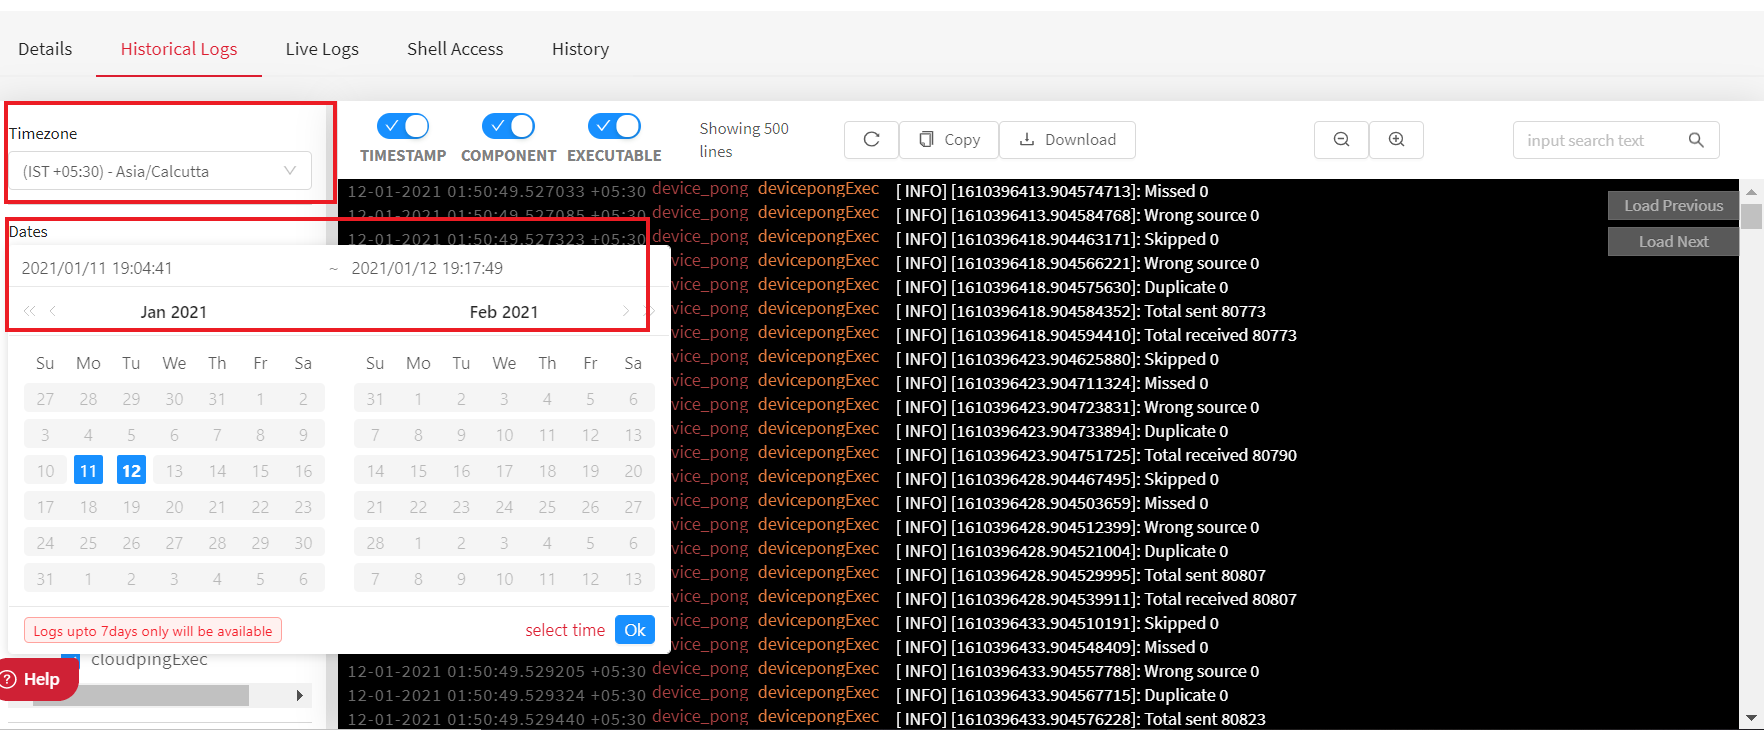
- Choose to view logs from within a time range.
Ensure the time slice is neither in the past from the start time of a deployment nor in the future from now. You will be able to view logs up to seven days in the past if a deployment has been running till now.
-
Download historical logs of a deployment as a .log file by clicking the download button. The Download Historical logs page appears. Clicking on the button with the download icon, the Paginated Download Logs modal should appear. If the logs are less than 100,000 lines, they are directly downloaded, and the modal is not shown.
-
Refresh the logs by clicking the refresh button.
Any errors or exceptions that occur while logs are being generated are redirected to stderr output window, but otherwise, a valid logs output is displayed in stdout window.
Indexed Logs
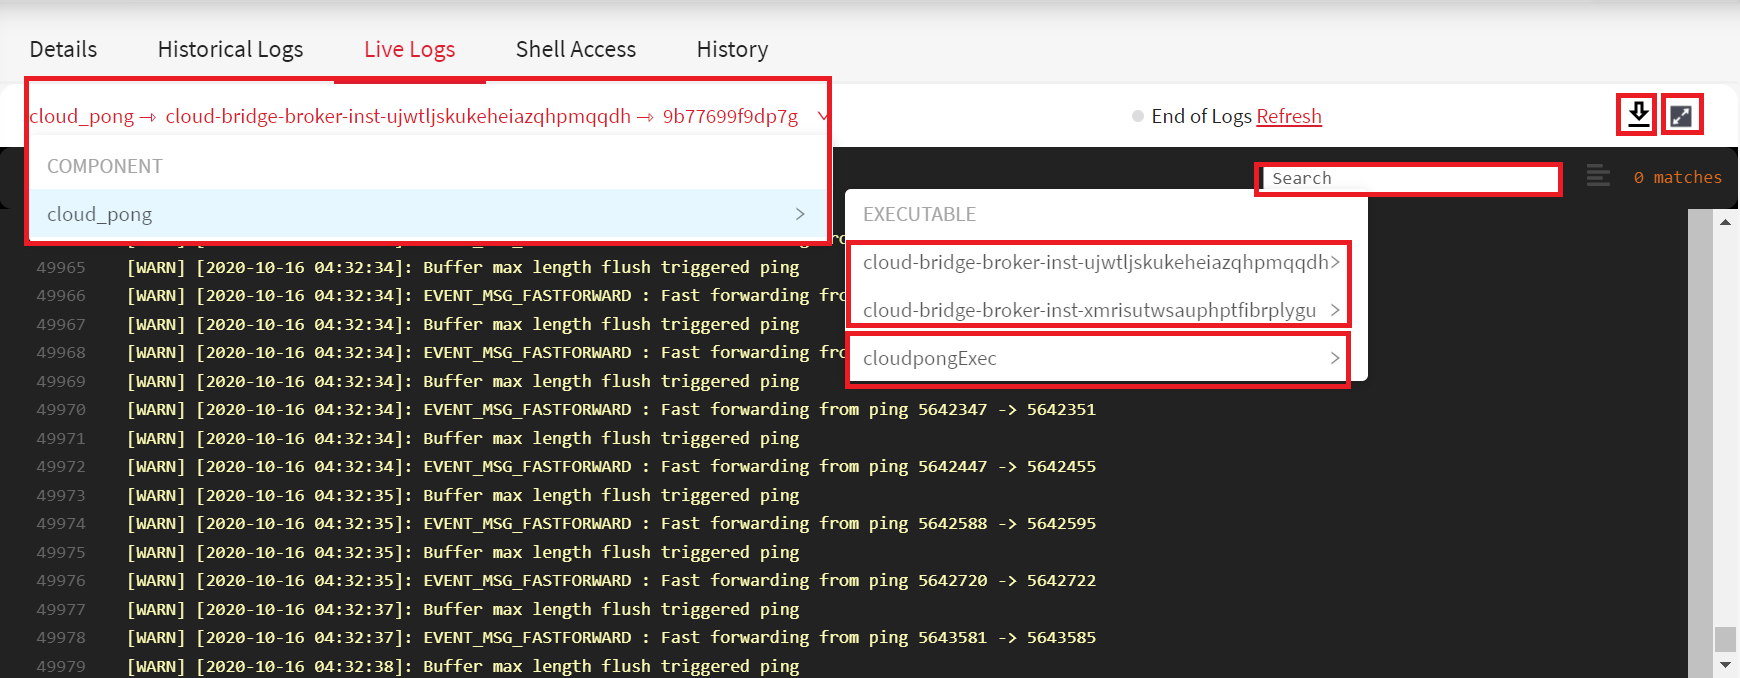
To view the corresponding deployment logs in real-time, click Live Logs tab. They are streamed in a terminal-like window and can be useful to view and debug your application in the cloud as it generates new logs.
It is similar to the tail -f functionality one is used to in a UNIX terminal console.
The Live Logs tab allows you to do the following:
-
View the real-time logs of the deployed components and the associated cloud bridges.
-
Download the live log details to your local machine by clicking the download icon.
-
Search for a specific phrase in the continuous log stream by entering the phrase inside the Search box. If there is a match, all occurrences of matching patterns of the phrase are highlighted.
-
View logs in the full-screen mode by clicking on the fullscreen icon that is located at the top right corner of the terminal-like window.
Device Logs
By default, device logs are not collected until you explicitly subscribe to a ROS topic in case of ROS deployments.
Before viewing device logs, ensure the ROS Master is up and running. Add a ROS Publisher package that has a Talker component with device runtime. It publishes /telemetry ROS topic with High QoS.
To view device logs:
- In the rapyuta.io console, on the left navigation bar, click Devices > All Devices.
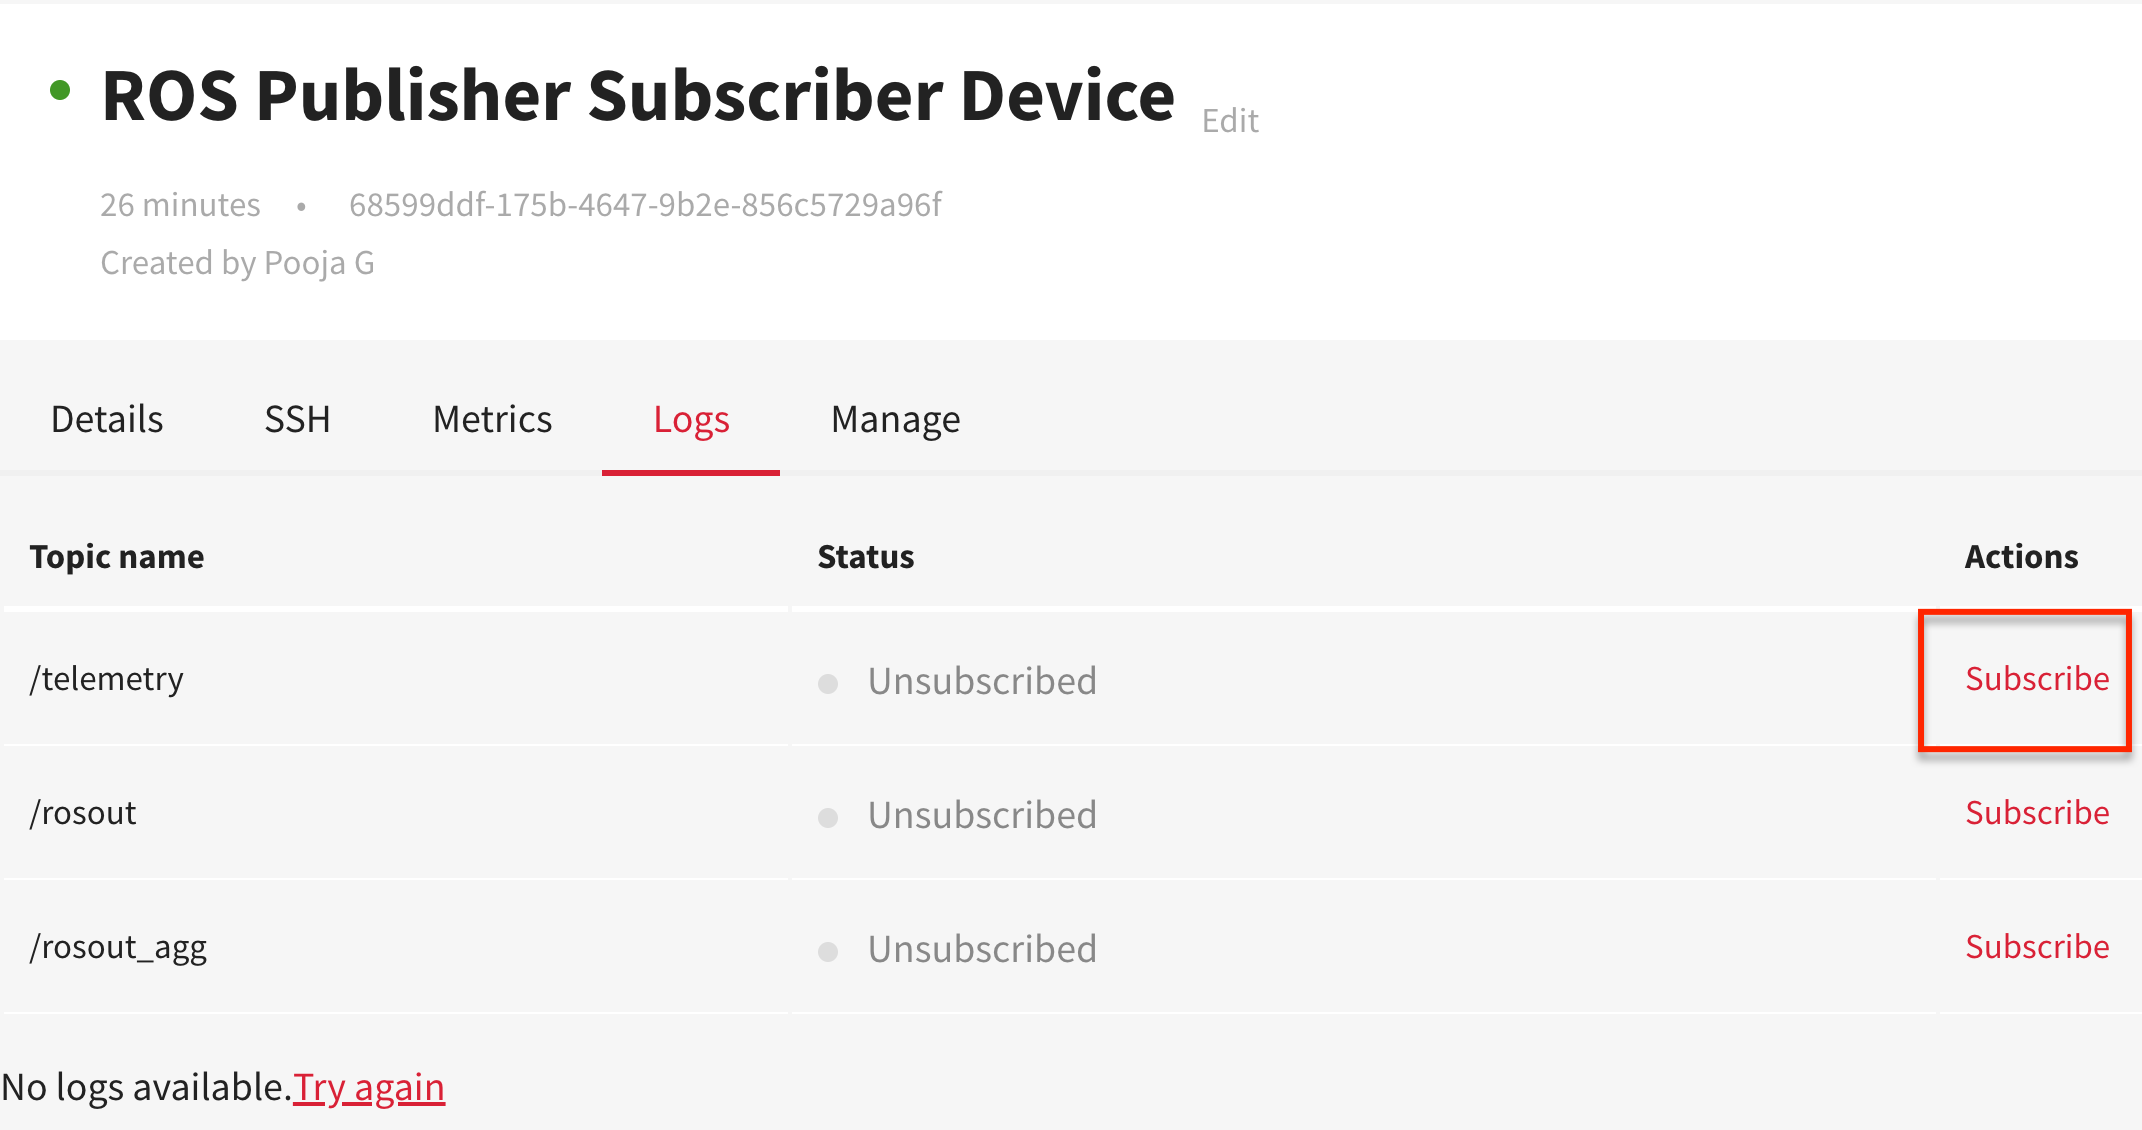
- Select a device whose device logs you want to view. In this example, ROS Publisher Subscriber Device is selected.
- Under Logs tab, to subscribe to a ROS topic, click Subscribe against the topic. In this example, the topic
/telemetryis subscribed. Ensure the status of the subscribed topic(s) is Subscribed and is highlighted in green.
Once you subscribe to a topic, the device logs are displayed in the logging area (a terminal-like window).
Initially, you will see the latest 500 logs in the logging area. As you scroll up to the top of the terminal window, the previous 500 logs are displayed. You may continue scrolling up till all the logs are exhausted.
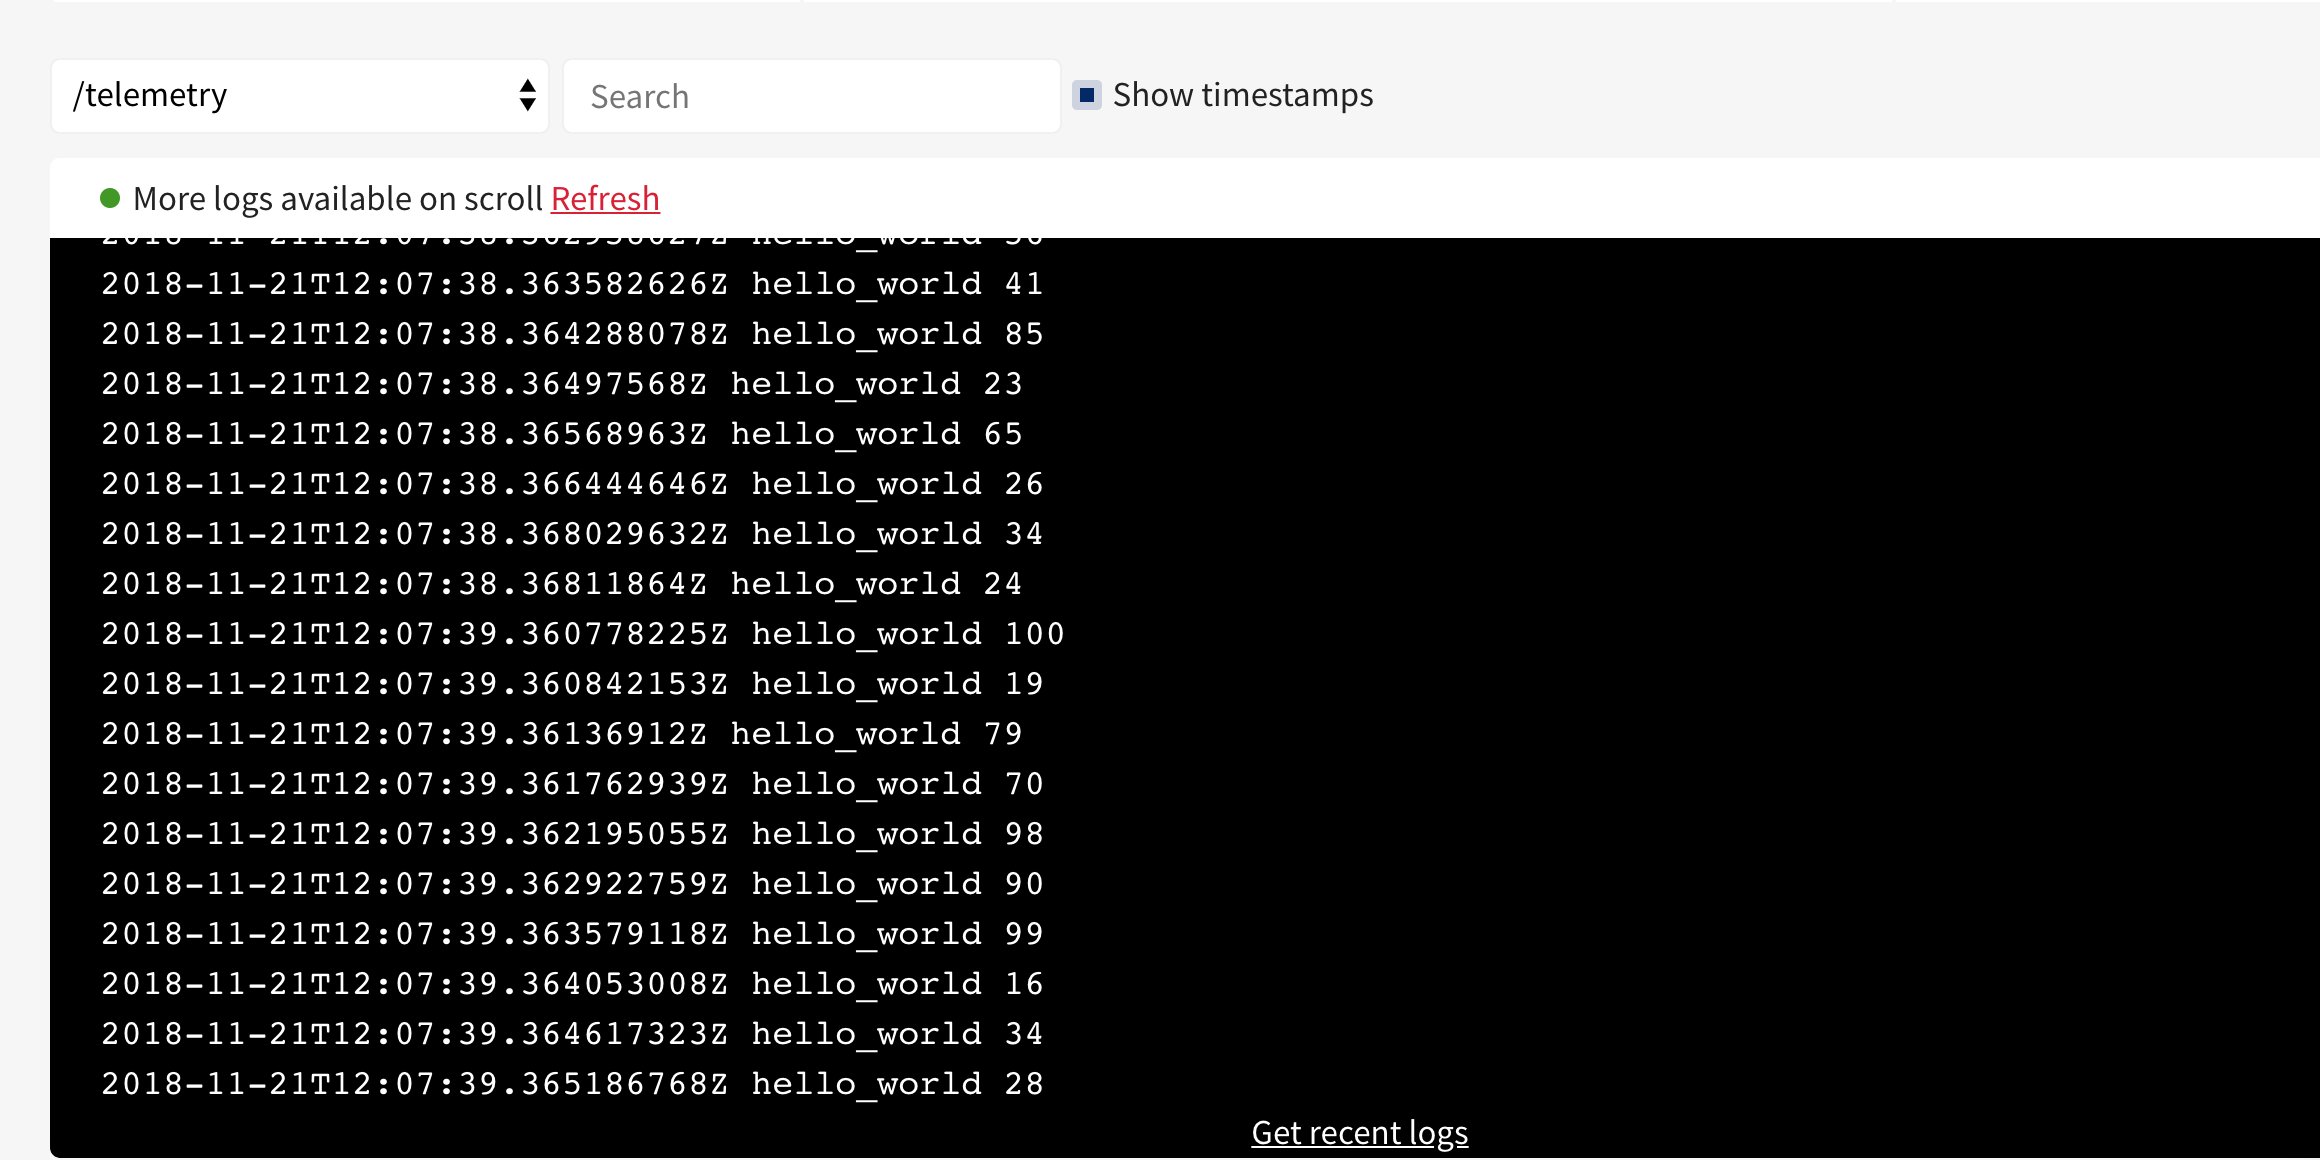
To get updated logs, scroll down to the bottom of the logging area, and click Get recent logs.
To switch between the topics, click the drop-down list (at the top-left corner of the logging area) and select one of the subscribed topics. A tick mark against the topic /telemetry indicates that you are currently viewing the logs belonging to /telemetry.
You can search the logs for matching phrases using the Search bar. All occurrences of a match are highlighted.
If you prefer to view the timestamp of every log displayed in the logging area, select Show timestamps checkbox.
Topics such as /rosout and /rosout_agg are already available for a ROS-based device.
Build Logs
Build logs are generated when rapyuta.io converts the source code of a git repository into a runnable docker image.
To view build logs of a build:
-
In the rapyuta.io console, on the left navigation bar, click Development>Builds.
-
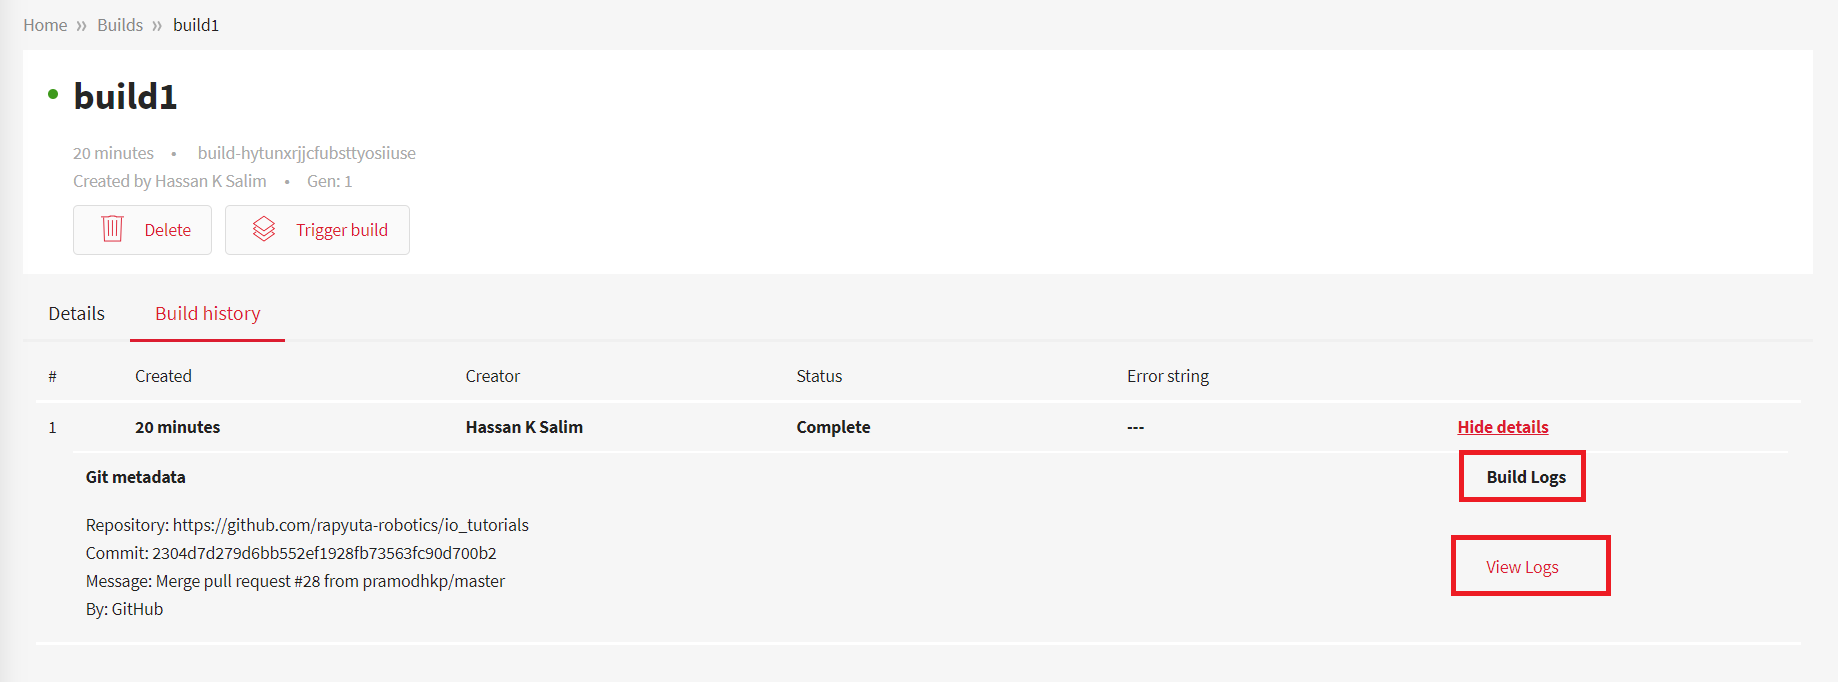
Select a build from the build list page. Click SHOW MORE and go to Build history tab.
The tab displays the time of build creation, the author who created it, the build status, and the error string.
-
To view details of the git repository such as repository’s name, commit number, commit message, and the git hosting platform, click View details/logs.
-
Click on View logs, to see the build logs.
-
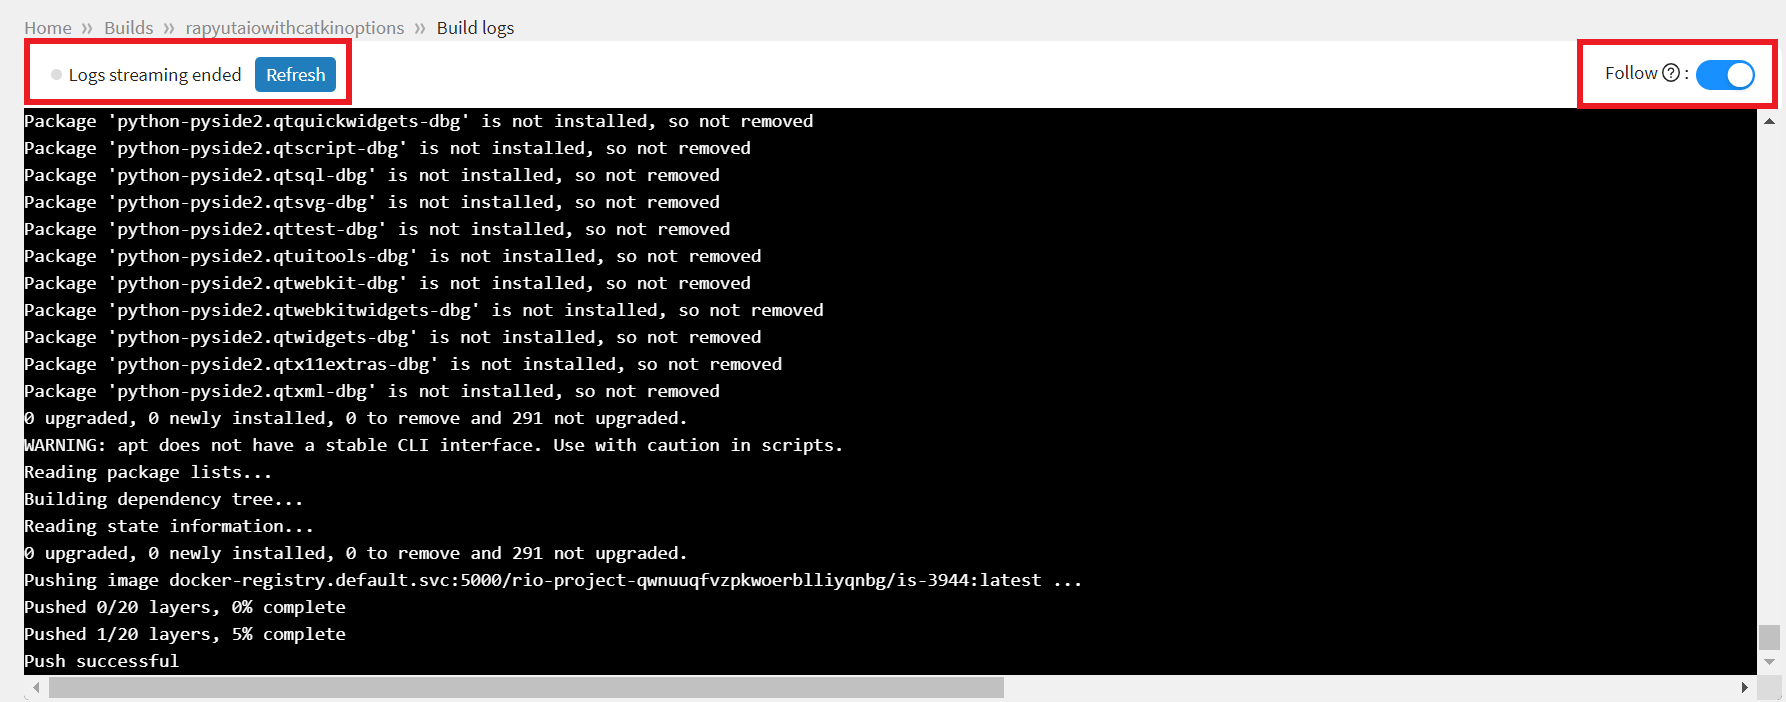
Build logs are displayed in the logging area (terminal-like window). To follow the displayed logs, click Follow toggle button.
Once all of the build logs are generated, the status indicator greys out and you’ll see a Logs streaming ended status (top left corner of the terminal window). If you see an error and the logs are not being generated, click Refresh.
Routed Network Logs
Viewing routed network logs is the same as viewing any component logs. To view or analyze the corresponding routed network logs:
- Click Historical Logs, under Source check the routed network for which you want to view the logs.
Native Network Logs
Viewing native network logs is same as viewing any component logs. To view or analyze the corresponding native network logs:
- Click Historical Logs, under Source check the native network for which you want to view the logs.