In this article
Help us make these docs great!
All rapyuta.io docs are open source. See something that's wrong or unclear? Submit a pull request.
Make a contributionMetrics Visualization
Monitoring metrics is important as it helps you understand resource usage in your devices. You can now visualize the following resource metrics in the rapyuta.io console:
- CPU Usage - Displays the percentage of the CPU used.
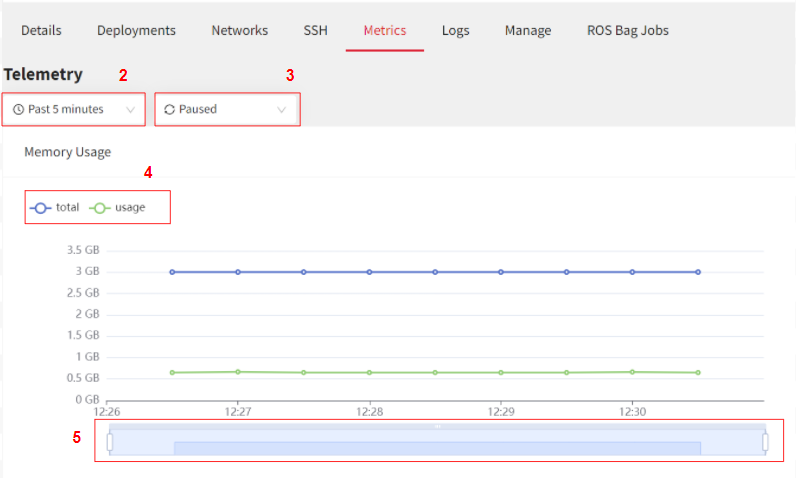
- Memory Usage - Displays the total memory being used.
- Disk Usage - Displays the total disk space being used.
- Network In and Out - Displays the amount of data being sent and received in bytes.
- Disk IO - Displays the amount of data being read and written.
To visualize the graphical representation of the metrics data:
- In the rapyuta.io console, click Devices > All Devices, select the device and click the Metrics tab.
- To change the time range, click Past 5 minutes drop-down menu and select the range. You can also set a Custom interval by specifying the time and date range.
- To change the refresh interval, select Every minute drop-down menu and select the interval.
- You can also customize the options that can be viewed in the graph. For example, in the image below, you can view the total amount of memory present and the amount used, to view only the usage, simply click on the total option to unselect it.
- You can use the slider below the graph to zoom in and view a sub section of the graph.
To visualize more system metrics, see Deploying Grafana to Visualize Metrics.