In this article
Help us make these docs great!
All rapyuta.io docs are open source. See something that's wrong or unclear? Submit a pull request.
Make a contributionCreating Debug Environment
Creating a Cloud Debug Environment
You can create a debug environment for any cloud runtime component in a deployment. To create a debug environment:
Debug environment works best if your cloud runtime component is above 1 core i.e small.
-
In the rapyuta.io console, on the left navigation bar, click Development > Deployments and select the deployment.
-
In the deployment details page, from the Debug Environment drop-down, select the component and then select the executable for which you want to create a debug environment.
-
In the Create New Debug Environment page:
- Enter the Name for the debug environment.
- Select the capability to debug the executable. The available options are; IDE, SHELL,Rviz, and RQT.
- Click Connect. It takes a few minutes to connect. Once the connection status is Complete, the debug environment is created successfully. <!– where to check connection status ?> For more information, see Connection Status of a Debug Environment.
- Once the debug environment is created, copy the Access Key to a clipboard. The access key will be used as the password to access any capability in this debug environment.
- In case your cloud component contains multiple replicas, debug environment will always be connected to the first running replica.
Debug using Capabilities
After you have created a debug environment, select the environment to debug your application. You can use one or more of the following capabilities to debug your executable.
IDE
To debug using IDE capability:
-
After you create the debug environment, navigate to the debug environment from the deployments details page.
-
Click IDE.
-
Enter the access key as the password and click Connect.
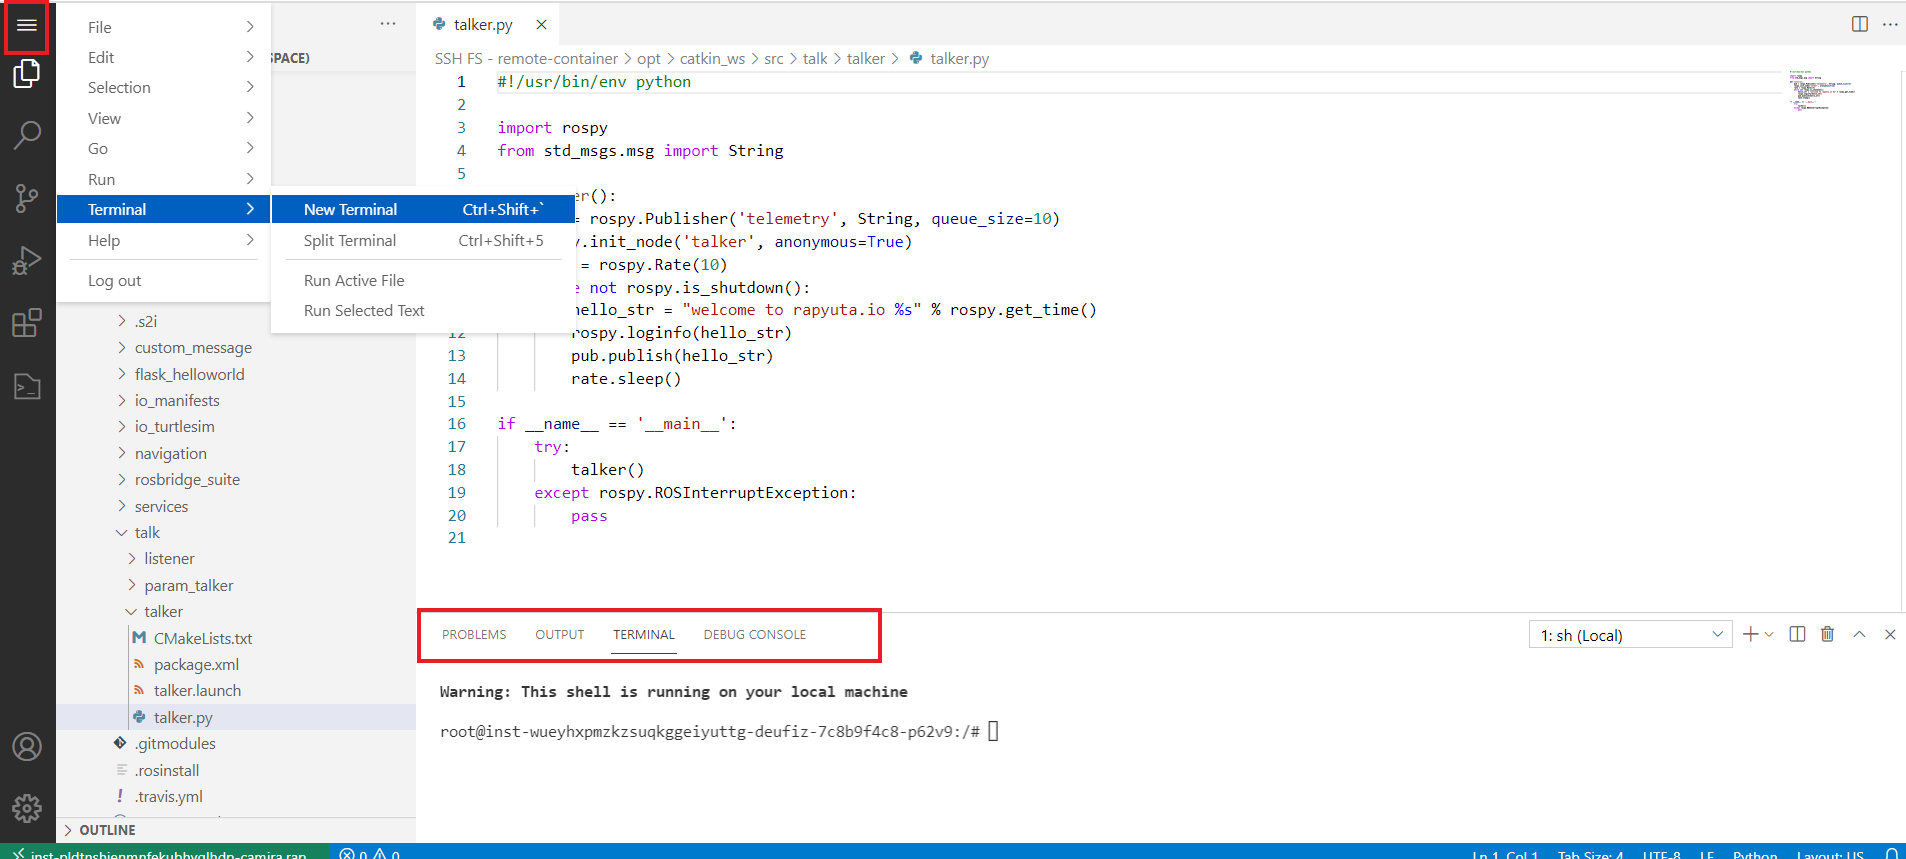
An online VS code editor is displayed. You can perform the following operations:
- To edit the source code, navigate to the directory and click the file to start editing.
- To open a terminal from the IDE, select Application Menu in left navigation bar and click Terminal > New Terminal.
- After you make the required changes, to restart your executable using catkin build recipe, type
restart-deployment-executablein the terminal. It takes few minutes to restart and the updated changes are reflected in the deployment. For more information, see Docker Image Support for Debug Environment.
Shell
To debug using the Shell capability:
-
After you create the debug environment, navigate to the debug environment from the deployments details page.
-
Click Shell.
-
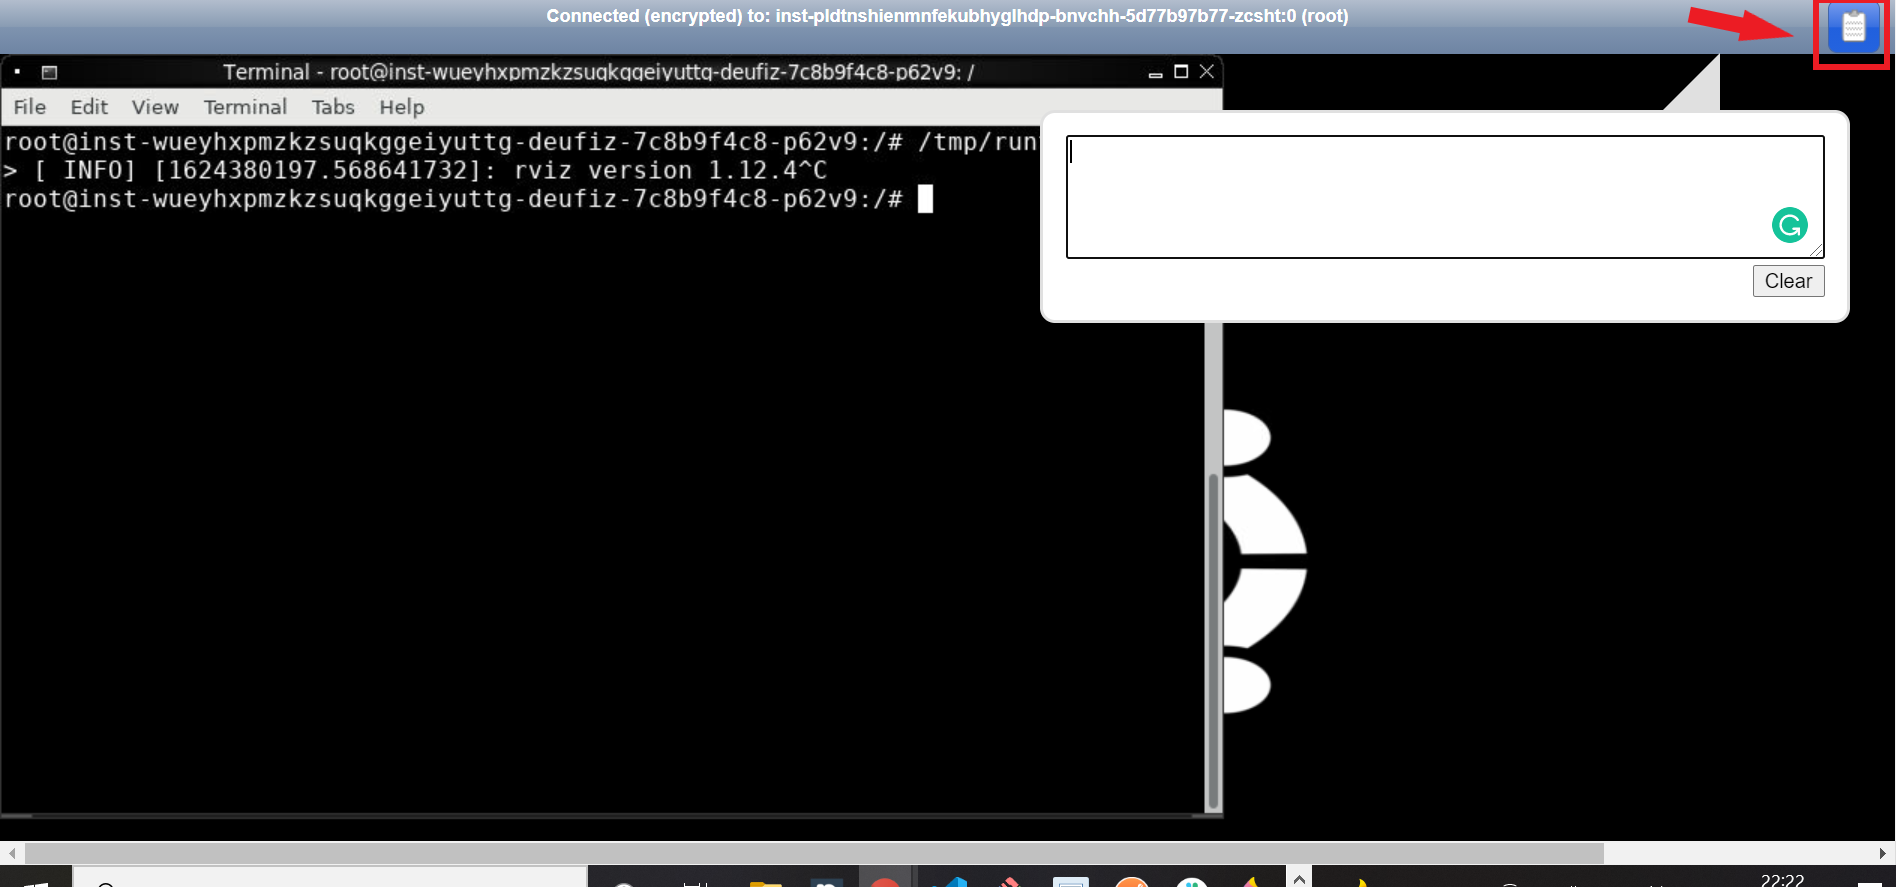
Enter the access key as the password and click Connect. A GUI based shell is displayed and allows you to run custom commands or open tools like RQT and RVIZ.
-
The shell interface also allows you to copy a command from a different window and paste it. To do so, paste the copied command in the clipboard. You can copy commands from the clipboard and paste it in the shell. Similarly, if you want to copy any text from the shell, paste it in the clipboard and from the clipboard you can copy the text and use it in other interfaces.
RQT
To visualize your ROS components in a deployment using the RQT tool:
-
After you create the debug environment, navigate to the debug environment from the deployments details page.
-
Click RQT.
-
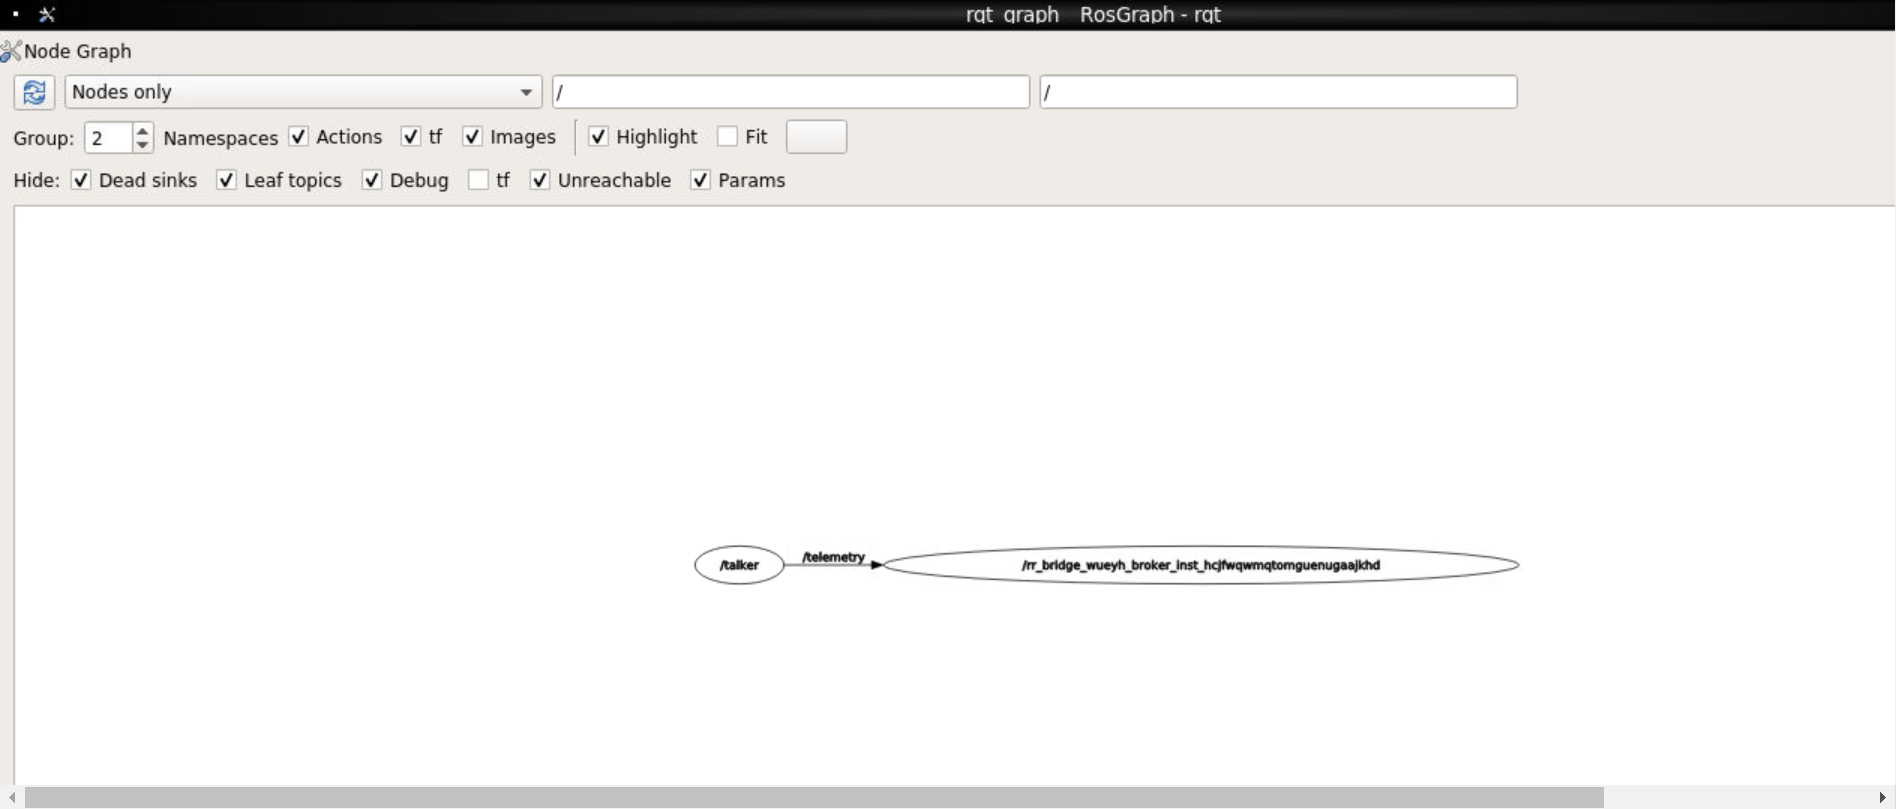
Enter the access key as the password and click Connect. A RQT tool is displayed. You can visualize the graphical representation of your ROS nodes in your deployment. For more information, see Using RQT Tool
RVIZ
To view the 3D model of your robot using the RVIZ capability:
-
After you create the debug environment, navigate to the debug environment from the deployments details page.
-
Click RVIZ.
-
Enter the access key as the password and click Connect. A RVIZ tool is displayed with a 3D model of your components.
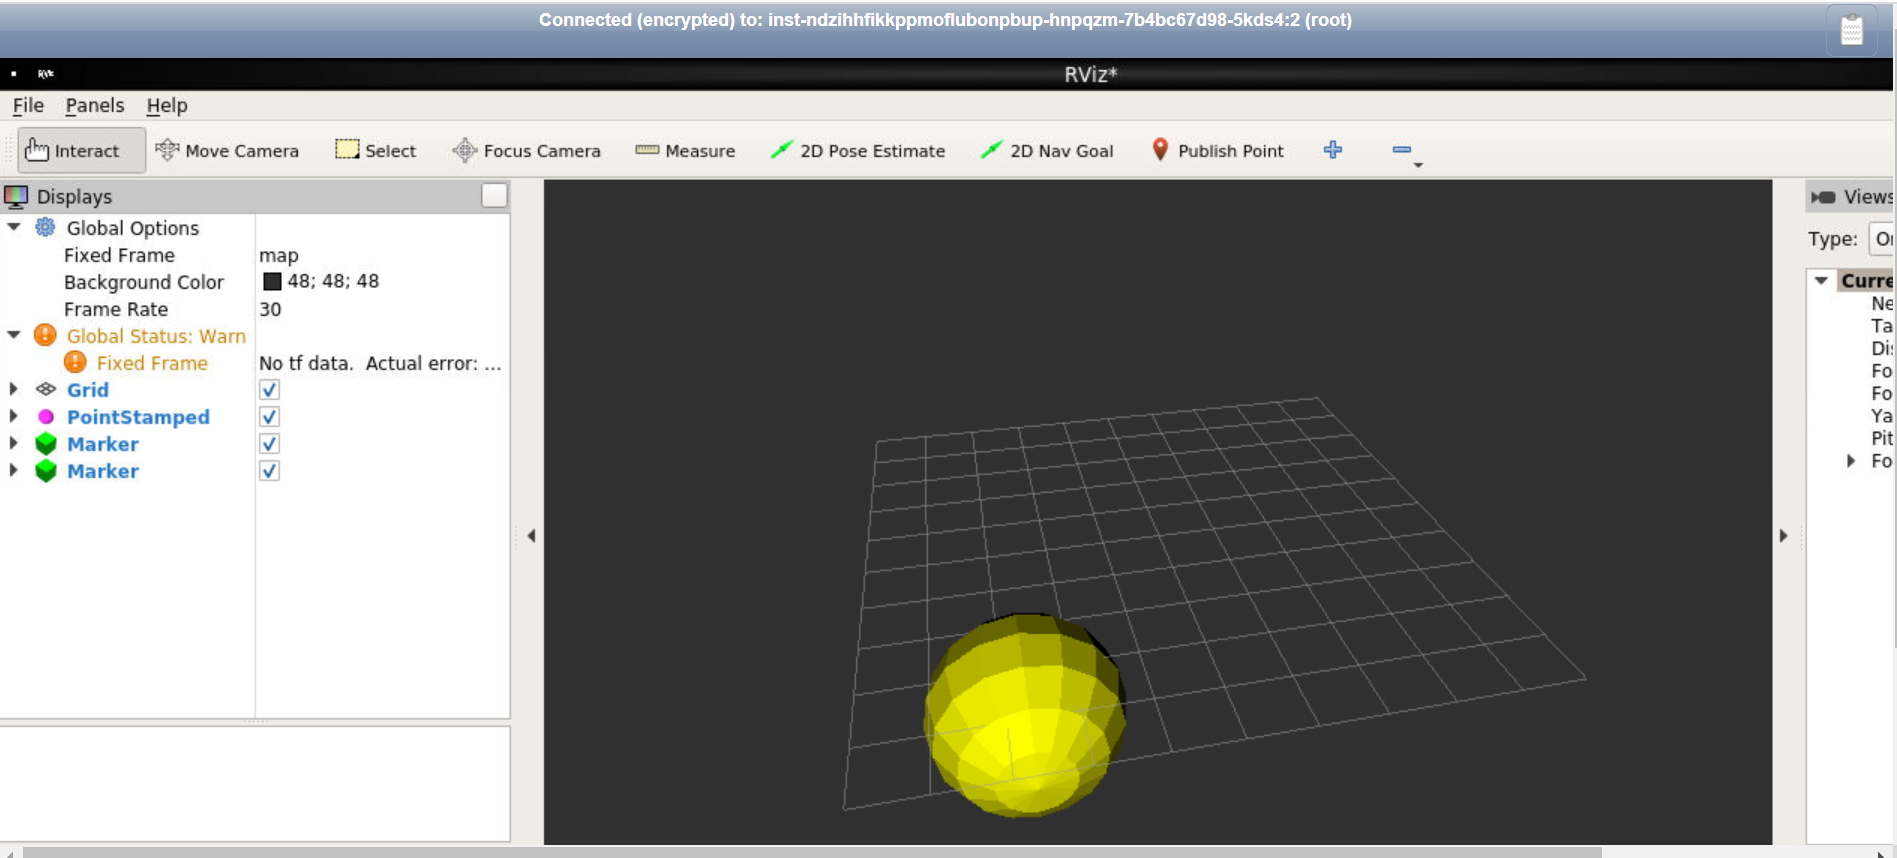
- To add a new display, click Add in the RVIZ UI. For more information, see Using the RVIZ tool.
Managing a Cloud Debug Environment
- To update a debug environment:
-
Navigate to the debug environment in the deployments details page and click Update.
-
Select/De-select the capability that you want to add/remove from the debug environment and click Update.
-
To view all the available debug environments, navigate to the Debug Environment page. All the available debug environments are displayed in a list view.
-
To delete a cloud debug environment, navigate to the debug environment in the deployments details page, click Delete and confirm.
Before you start deleting or deprovisioning a deployment, ensure that you have deleted the debug environment connected with the deployment.